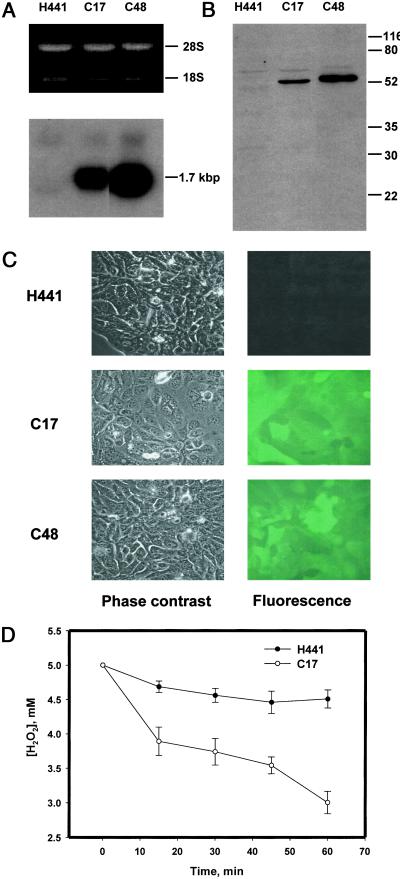
Figure 1.
Expression of a rat 1-cysPrx-GFP fusion product. (A) RNA gel (Upper) and Northern blot (Lower) of H441, C17, and C48 cells. (B) Western blot (25 μg total cellular protein) from H441, C17, and C48 cells. Relative migration of molecular mass markers (in kDa) is indicated on the right. (C) Fluorescence and corresponding phase-contrast images of H441, C17, and C48 cells. (×60.) (D) Time course for degradation of H2O2 (5 mM initial concentration) by 2.5 × 10⁵ H441 or C17 cells in the presence of 50 mM aminotriazole. Data are mean ± SEM for n = 3. For comparison of H441 and C48. P < 0.05 at each time after zero.

