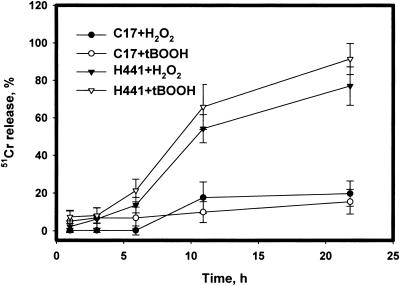
Figure 2.
Cell injury during exposure of H441 or C17 cells to 5 mM H2O2 or 0.75 mM t-BOOH. Cells were preloaded with 51Cr and assayed at the indicated times for 51Cr release. Data are the mean ± SEM for n = 4. Comparing the same peroxide, differences for H441 and C17 are P < 0.05 at each time point beyond 3 h. Comparison of the two peroxides for the same cells are P > 0.05 at all time points.

