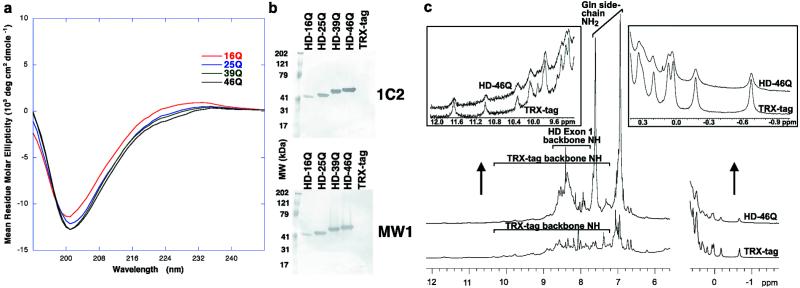
Figure 2.
Structural characterization of HD exon 1. (a) CD spectra. Each curve represents the difference between the spectrum of an HD exon 1 fusion protein and the spectrum of the TRX-tag control protein (i.e., the CD signal attributable to HD exon 1). (b) Western blots using 1C2 and MW1. Equimolar amounts of HD exon 1 fusion proteins or TRX-tag were loaded and probed with a 1:2000 dilution of ascites fluid containing 1C2 (Chemicon) or 200 nM purified MW1. (c) Comparison between 1H NMR spectra of TRX-tag and HD-46Q. Only the amide and aromatic proton region and the upfield-shifted methyl region are shown. (Insets) Expanded views.

