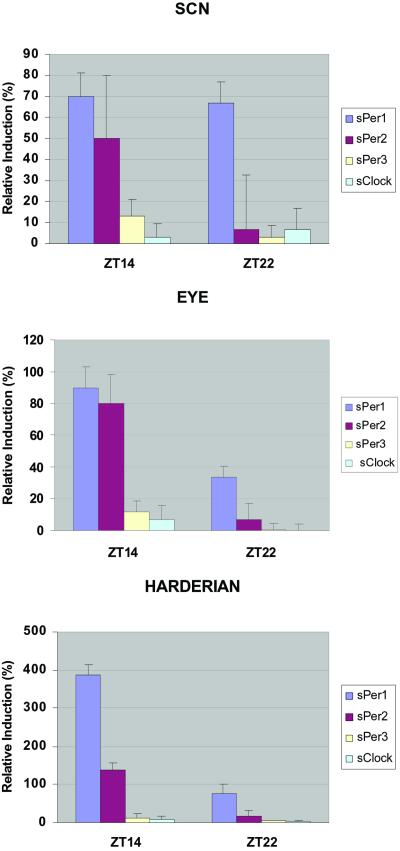
Figure 4.
Light inducibility of the three Spalax Per genes' expression. Animals were given a 15-min light pulse at ZT14 and ZT22 and killed 1 h later. Coronal sections through the brain and ISH were performed on treated (ZT14 pulse and ZT22 pulse) and control animals that were killed at the same time. Relative mRNA induction was analyzed by densitometric analysis of in situ silver grain staining. sClock inducibility is given as negative control. (Top) In the SCN, sPer1 is equally inducible at ZT14 and ZT22. sPer2 is inducible only at ZT14, whereas sPer3 gene shows no measurable changes in expression levels at the two time points. (Middle) Inducibility of sPer1, sPer2, and sPer3 in the eye is similar to that in the SCN. (Lower) In the harderian gland, sPer1 is highly inducible at ZT14 and less at ZT22 whereas sPer2 expression is light sensitive only at ZT14. sPer3 shows no light inducibility at either time point. Note the significantly (P < 0.01) higher induction of sPer1 in the harderian gland compared with the other tissues after light pulse at ZT14. Note the different y-axis scales in SCN, eye, and harderian.

