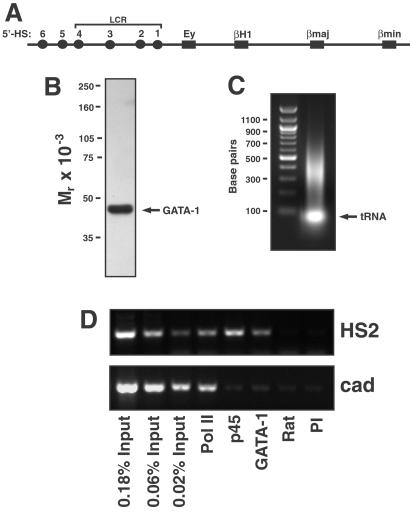
Figure 1.
GATA-1 binding to the endogenous β-globin locus of MEL cells. (A) Structure of the murine Hbbd β-globin locus. (B) Specificity of anti-GATA-1 antibody. Western blot analysis of total MEL cell lysate with anti-GATA-1 antibody. The sole reactive band, GATA-1, is indicated by the arrow. (C) Agarose gel analysis of sonicated chromatin. The representative ethidium bromide-stained agarose gel shows input DNA isolated from chromatin after reversal of crosslinks and deproteination. The average size of the chromatin is ≈400 bp. (D) ChIP analysis of pol II, p45/NF-E2 (p45), and GATA-1 binding to HS2 of the endogenous murine β-globin locus. The representative ethidium bromide-stained agarose gel shows PCR products obtained by ChIP from MEL cell lysates with HS2 and cad promoter primers. The numbers indicate the percent of input DNA used in the corresponding PCRs. Only HS2 DNA was specifically immunoprecipitated with anti-p45 and anti-GATA-1 antibodies, whereas HS2 and cad promoter DNA were specifically immunoprecipitated with anti-pol II antibody. Rat, rat IgG; PI, rabbit preimmune sera.

