Figure 5.
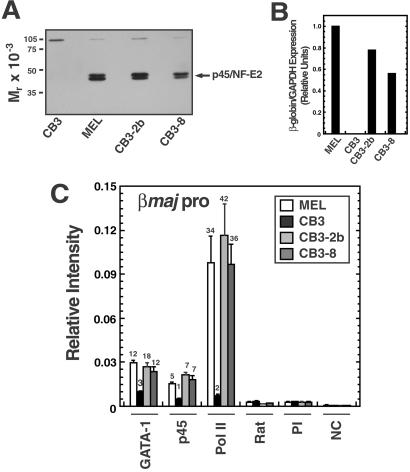
Quantitative analysis of NF-E2-dependent GATA-1 and pol II recruitment to the βmajor promoter. (A) Western blot analysis of p45/NF-E2 expression in total cell lysates from MEL and CB3 cells, and two independent CB3 cell lines stably expressing p45/NF-E2. (B) Real-time PCR analysis of β-globin RNA expression in the cell lines of A. β-globin RNA levels were normalized to glyceraldehyde-3-phosphate dehydrogenase (GAPDH). (C) Real-time PCR ChIP analysis of binding of GATA-1, p45/NF-E2, and pol II to the βmajor promoter. Signals obtained for immunoprecipitated samples from four independent experiments (mean ± SEM) are expressed relative to a standard curve generated from the input samples. Values shown above the bars represent the ratio of signals obtained relative to the appropriate control antibody. Rat, rat IgG; PI, rabbit preimmune sera; NC, no chromatin.

