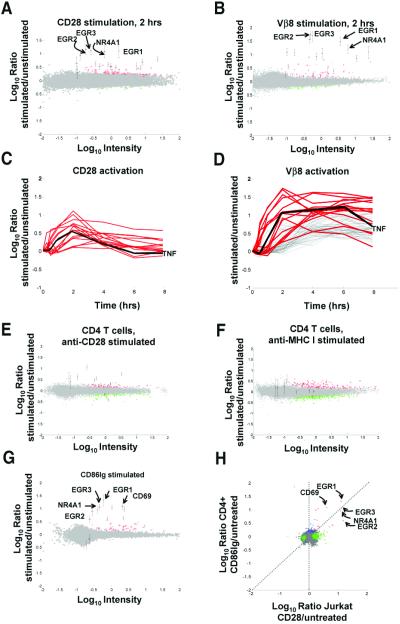
Figure 1.
CD28 stimulation induces gene regulations in T cells. (A) CD28 stimulation induces gene regulations in Jurkat T cells. Jurkat T cells were left untreated or were stimulated with soluble anti-CD28 mAb for 2 h. Gene regulations induced by treatment were detected by competitive hybridization to ink-jet DNA microarrays. Plotted is the average from duplicate microarrays of the Cy5/Cy3 hybridization ratio for each oligonucleotide versus the hybridization intensity for that oligonucleotide. In this representation, the y axis is an estimation of the ratio of expression for a given transcript in stimulated/unstimulated cells, whereas the scale on the x axis is proportional to transcript abundance. Red and green pseudocolors indicate Cy5 and Cy3 labeling, respectively. Genes expressed significantly (P < 0.01) more in treated cells (up-regulated genes) are colored red; significantly down regulated genes are colored green; genes whose expression was not significantly altered during stimulation are colored gray. Consensus Jurkat CD28-induced genes (see Table 2) are indicated with error bars (±SD). Selected CD28-induced genes are flagged: EGR1, X52541; EGR2, J04076; EGR3, X63741; NR4A1, D49728. (B) TCR stimulation alone induces gene regulations in Jurkat T cells. Jurkat T cells were left untreated or were stimulated with plate-bound anti-Vβ8 mAb for 2 h. Detection of gene regulations by DNA microarray analysis was performed and depicted as in A. Consensus Jurkat CD28-induced genes are indicated as in A. (C) CD28-induced genes have immediate-early kinetics. Jurkat T cells were left untreated or were stimulated with soluble anti-CD28 mAb for 0, 0.25, 0.5, 12, 2, 4, and 8 h. Detection of gene regulations by DNA microarray analysis was performed as in A. Red curves depict the kinetics of regulation for consensus Jurkat CD28-induced genes. No additional genes were regulated >2-fold, P < 0.01 for at least two time points. Genes not significantly regulated are not depicted. Black line, TNF, tumor necrosis factor, X01394. (D) CD28-induced genes are a subset of TCR-induced genes. Jurkat T cells were left untreated or were stimulated with plate-bound anti-Vβ8 mAb as in C. Red curves depict the kinetics of regulation for consensus Jurkat CD28-induced genes in Vβ8-stimulated cells. Gray curves indicate hybridization ratios for additional Vβ8-induced genes showing 2-fold regulation; P < 0.01 for at least two time points. Genes not significantly regulated are not depicted. (E) Anti-CD28 mAb induces gene expression changes in CD4 T cells. CD4 T cells were stimulated with anti-CD28 beads for 2 h. Consensus CD4 T cell CD86Ig-induced genes (see Table 2) are denoted with error bars. (F) CD28-induced genes are not induced by MHCI engagement in CD4 T cells. CD4 T cells were stimulated with anti-MHC beads for 2 h. Consensus CD4 CD28-induced genes are denoted with error bars. (G) CD28 stimulation by a natural ligand induces gene regulations in CD4 T cells. CD4 T cells were left untreated or were stimulated with CD86Ig beads for 2 h. Detection of gene regulations by DNA microarray analysis was performed and depicted as in A. Consensus CD4 T cell CD28-induced genes (see Table 2) are indicated with error bars (±SD). Selected CD28-induced genes are flagged as in A, with the addition of CD69, NM_001781. (H) Similar genes are induced by CD28 stimulation in Jurkat and CD4 T cells. Shown is a comparison (correlation) of genes significantly regulated (P < 0.01, log10 intensity >−1) in anti-CD28-treated Jurkat T cells (A, x axis) versus CD86Ig-treated CD4 T cells (G, y axis). Red, genes significantly regulated under both conditions; green, genes significantly regulated in X dimension; blue, genes significantly regulated in Y dimension; brown, genes showing opposite regulation in the two conditions; gray, genes not significantly regulated in either dimension. Selected genes significantly induced under both conditions are flagged.

