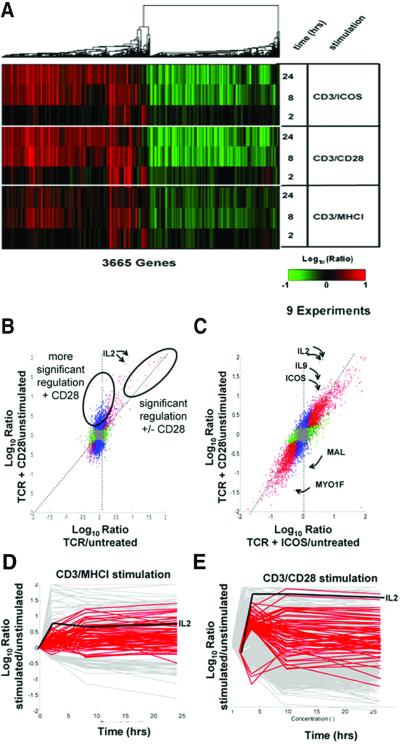
Figure 2.
CD28 costimulation primarily induces quantitative rather than qualitative changes in transcript levels. (A) Overall similarity of gene regulations induced by stimulation of TCR alone, TCR plus CD28, and TCR plus ICOS. Human peripheral blood CD4 T cells were cultured for the indicated times with CD3/MHCI, CD3/CD28, or CD3/ICOS beads. Shown is a display of regulations from 3665 genes significantly regulated (P < 0.01, >2-fold regulation, log10 intensity >−1 in at least two experiments) over a total of nine experiments. The dendrogram depicts the similarity of co-regulation of the indicated genes, with the length of the “branches” proportional to the degree of similarity of co-regulation. This experiment was repeated twice with equivalent results. (B) CD28 costimulation induces changes in levels of most but not all transcripts induced by TCR stimulation. CD4 T cells were left untreated or were stimulated with CD3/MHCI or CD3/CD28 beads for 2 h as in Fig. 2A. Shown are comparisons (correlations) of genes significantly regulated (P < 0.01, intensity >−1) in CD3/MHCI stimulated T cells (x axis) versus CD3/CD28 stimulated T cells (y axis). The plot is colored as in Fig. 1F. The dotted diagonal line indicates the expected positions of gene regulated equally by both stimulation conditions and the vertical dotted line, genes regulated only with CD28 costimulation. Ovals identify genes significantly regulated with or without CD28 costimulation or genes showing more significant regulation with CD28 costimulation. Genes flagged red, blue, and brown showed similar patterns of regulation in an independent experiment; those flagged green were not reproducible. The positions of S82692 and NM_000586, and IL2, are indicated. (C) CD28 and ICOS costimulation induces similar regulation in all but a few transcripts. CD4 T cells were left untreated or were stimulated with CD3/CD28 or CD3/ICOS beads for 8 h as in Fig. 2A. Shown are comparisons (correlations) of genes significantly regulated (P < 0.01, log10 intensity >−1) in CD3/ICOS -treated T cells (x axis) versus CD3/CD28-treated T cells (y axis). The positions of selected off diagonal genes regulated much more highly following CD28 costimulation are indicated by arrows:IL2; NM_000590, IL9, interleukin 9; AB023135; ICOS, inducible co-stimulator; NM_002371, MAL, mal T cell differentiation protein; X98411, MYO1F, myosin 1F. (D and E) Genes showing increased regulation with CD28 at 2 h show slower kinetics of activation in cells stimulated with TCR alone. CD4 T cells were left untreated or were stimulated with CD3/MHCI or CD3/CD28 beads for 2, 8, or 24 h as in Fig. 3A. Shown is a representation of the kinetics of gene regulation by CD3/MHCI beads (D) and CD3/CD28 beads (E). Gray curves indicate hybridization ratios for genes showing 2-fold regulation; P < 0.01 for three time points. Red curves depict genes showing higher regulation following CD28 costimulation (>5-fold regulation, P < 1 × 10⁻⁴, approximately depicted by the labeled oval in Fig. 2B). Genes not significantly regulated are not depicted. The regulation of IL2 is shown for reference.

