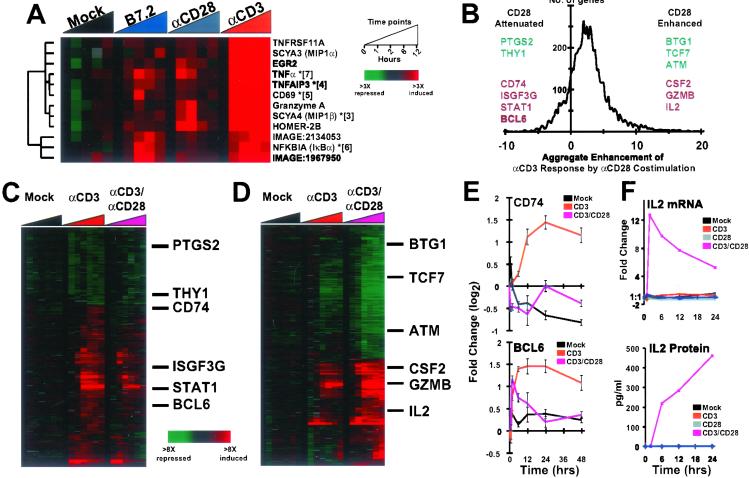
Figure 2.
Gene expression responses to CD28 ligands. (A) Genes with detectable responses to monostimulation by CD28 ligands. Geometric means are shown for genes represented by multiple cDNA elements (indicated by asterisks and number of averaged elements). (B) Aggregate enhancement of gene expression responses to αCD3 stimulation by costimulation with αCD28. The abscissa represents the difference in the response between monostimulation with αCD3 and costimulation with αCD3/αCD28 coated beads using a customized distance metric. Representative genes from both ends of the distribution are shown, exemplifying genes whose responses to αCD3 were enhanced or diminished by αCD28. Genes from the bottom 5 and top 10 percentiles of the distribution are depicted in C (348 elements), and D (538 elements), respectively. (E) Example genes from c, plotted as line graphs. Depicted data points represent the geometric mean of independent cDNA elements, with error bars indicating the corresponding standard error. (F) Comparison of IL-2 mRNA and protein levels.

