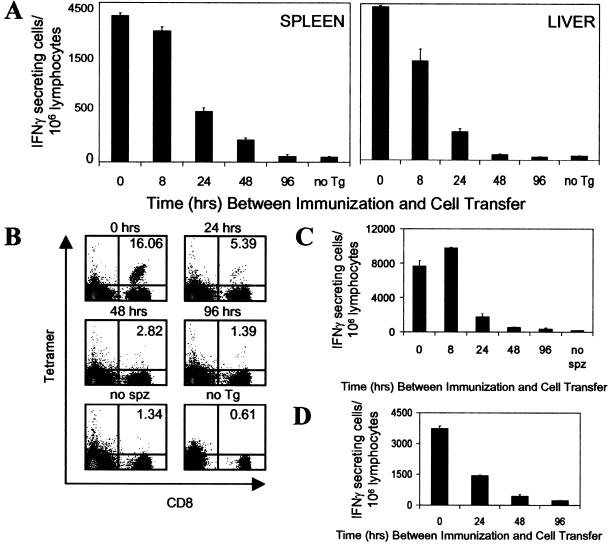
Figure 2.
Short-term antigen presentation defines the magnitude of the CD8+ T cell response. (A) Normal mice were immunized i.v. with 3 × 10⁴ attenuated sporozoites, and at different times postimmunization (8, 24, 48, 96 h), they received naïve Tg CD8+ T cells. The number and activation status of the Tg CD8+ T cells in spleens (Left) and livers (Right) for each experimental group were assessed by ELISPOT 4 days after transfer of Tg cells. As controls for full activation, mice received Tg cells at the time of immunization (0 h) and were analyzed 4 days later. Mice that were immunized but did not receive Tg cells (no Tg) served as controls for the endogenous CD8+ T cell response. (B) Spleen cells from A were stained with anti-CD8 antibodies and SYVPSAEQI tetramers. Plots were gated on lymphocytes, and the number in the upper right corner represents the frequency of CD8+ tetramer+ cells in the total CD8+ population. (C) Similar to A except that mice received day 8 activated/memory Tg CD8+ T cells. Mice that received activated/memory Tg cells but were not immunized (no spz) served as controls. The activation of the Tg CD8+ T cells in the spleen was measured by ELISPOT 4 days after transfer. (D) Similar to A except that RAG2−/− mice were used. Immunized mice received both naïve Tg CD8+ T cells and naïve spleen lymphocytes at indicated times. The activation of the Tg CD8+ T cells in the spleen was measured by ELISPOT 4 days after transfer. Results in A–D represent one of two to three similar experiments.

