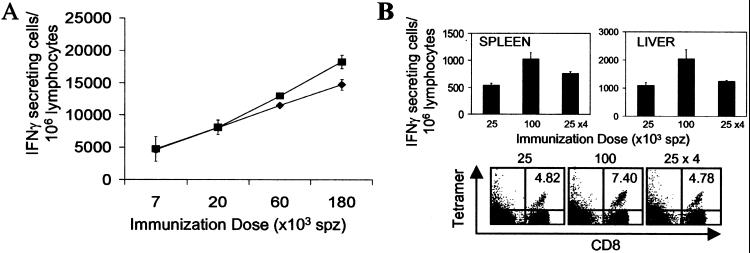
Figure 5.
Dependence of the CD8+ T cell response on priming dose and not on the length of time of antigen presentation. (A) Normal mice received and were immunized i.v. with indicated amounts of attenuated sporozoites. The activation and expansion of the Tg CD8+ T cells in spleens (⧫) and livers (■) were measured by ELISPOT 4 days after immunization. (B) Normal mice received Tg CD8+ T cells and were immunized with the indicated doses of attenuated sporozoites. The activation of the Tg CD8+ T cells in the spleens and the livers were measured by ELISPOT 14 days after the primary immunization (Upper). Spleen cells were stained with anti-CD8 antibodies and SYVPSAEQI tetramers, and plots were gated on lymphocytes; the number in the upper right corner represents the frequency of CD8+ tetramer+ cells in the total CD8+ population (Lower). Results in A and B represent one of two to three similar experiments (n = 3 mice/group). P values(100K vs. 4 × 25K for both spleen and liver) <0.05; P values(25K vs. 4 × 25K for both spleen and liver) = not significant.

