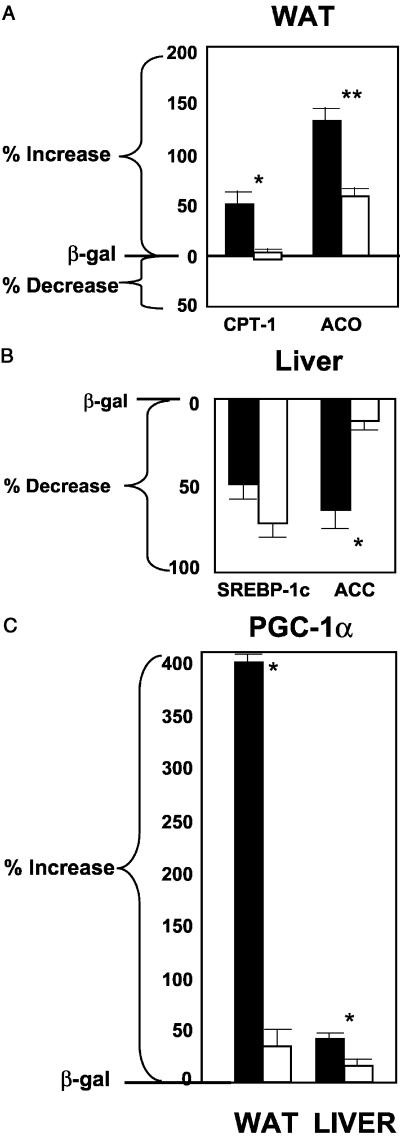
Figure 2.
(A) Comparison of mRNA, measured by real-time reverse transcription–PCR, of the oxidative enzymes CPT-1 and ACO in the epididymal fat (WAT) of PPAR+/+ and PPAR−/− mice 7 days after the i.v. administration of AdCMV-leptin or AdCMV-β-gal as a control. (B) Comparison of the mRNA of SREBP-1c and ACC in the liver of PPARα+/+ and PPARα−/− mice 7 days after the i.v. administration of AdCMV-leptin or AdCMV-β-gal. (C) Comparison of the mRNA ratios to β-actin of PGC-1α in WAT and liver of PPARα+/+ and PPARα−/− mice 7 days after the i.v. administration of AdCMV-leptin or AdCMV-β-gal. The mRNAs of interest are expressed as percent of that in AdCMV-β-gal-treated controls (mean ± SEM).

