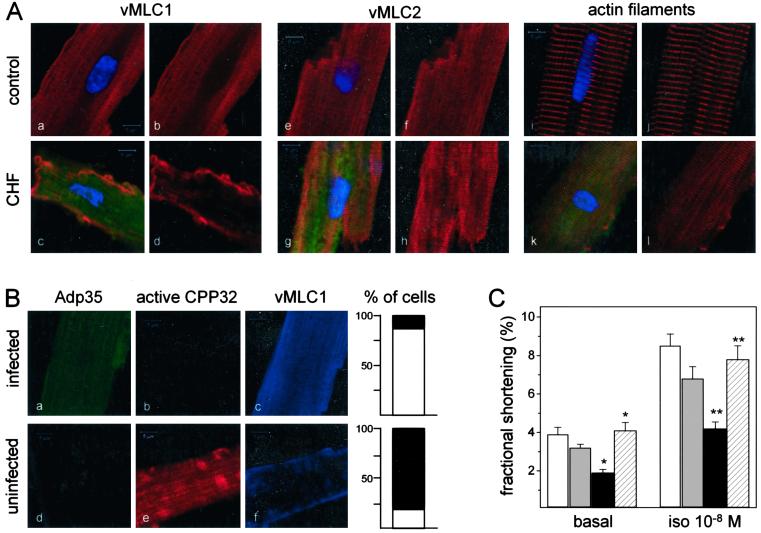
Figure 4.
In vivo cleavage of vMLC1 in failing cardiomyocytes is prevented by p35 overexpression with positive impact on myocyte contractile performance. (A) Laser scanning fluorescence microscopy of representative ventricular myocytes isolated from the anterolateral wall of control and failing myocardium. Green fluorescence (525 nm) shows activated caspase-3 identified by FAM-DEVD-fmk, blue fluorescence (480 nm) illustrates nuclei by Hoechst 33258, and red fluorescence (620 nm) reflects vMLC1 (a–d) or vMLC2 (e–h), or polymeric actin by phalloidin staining (i–l). (Scale bars = 5 μm.) One hundred cells isolated from three animals were analyzed in each group. (B) Representative ventricular myocytes isolated from failing myocardium after in vivo infection with Adp35 and visualized by laser scanning fluorescence microscopy. Green fluorescence (503 nm) identifies gfp and shows Adp35-infected cells, red fluorescence (580 nm) reflects activated caspase-3 labeled by SR-DEVD-fmk, and blue fluorescence (423 nm) illustrates vMLC1. (Scale bars = 5 μm.) Bar graphs represent the percentage of cells with organized (white pattern) or destroyed (black pattern) vMLC1 staining in the p35-infected and uninfected groups. One hundred fifty myocytes isolated from three animals were analyzed in each group. (C) Contraction amplitude under basal conditions and isoproterenol stimulation (10−8 M) measured in single left ventricle myocytes. White columns, cells from control myocardium; gray columns, cells from failing myocardium negative for activated caspase-3; black columns, cells from failing myocardium positive for activated caspase-3; hatched columns, cells from failing myocardium expressing p35. Data are expressed as mean ± SEM. n = 40 cells from three animals in each group. *, P < 0.005; **, P < 0.001 [in comparison with control or caspase-3-positive failing cells (basal, isoproterenol 10−8 M)].

