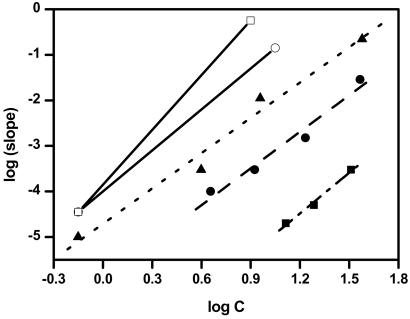
Figure 4.
Linear fits of log (½ k+2 Kn*c(n*+2)) vs. log c for K2Q28K2 (■), K2Q36K2 (●), and K2Q47K2 (▴). Reference lines with exact slopes of 3 (○) and 4 (□) are shown for comparison. The slope plotted is that from fits such as those shown in Fig. 3.

