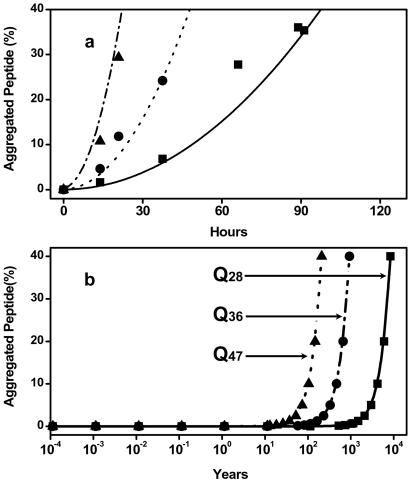
Figure 6.
(a) Simulated aggregation progress of K2Q36K2 at 8.4 μM (—), 17.1 μM (⋅ ⋅ ⋅), and 36.9 μM (– ■ –) and the experimental data of 8.4 μM (■), 17.1 μM (●), and 36.9 μM (▴). (b) Simulated aggregation progress of K2Q28K2 (■, —), K2Q36K2 (●, – ■ –), and K2Q47K2 (▴, ⋅ ⋅ ⋅) at a concentration of 0.1 nM.

