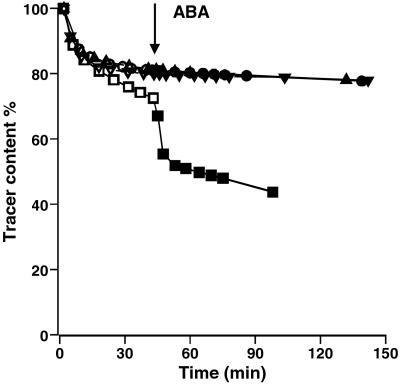
Figure 3.
Effect of PAO on the ABA-activated release of vacuolar 86Rb+. Tracer content (percentage of initial value) against time. Initial washout in the absence of ABA (white symbols) in the presence of 0, 5, 10, or 25 μM PAO. ABA added to all four sets (black symbols) at 40–44 min of efflux. Each curve shows the mean of four replicate strips (SEM of 2–3% of each value). PAO concentration: □ and ■, control; ▵ and ▴, 25 μM; ○ and ●, 10 μM; ▿ and ▾, 5 μM.

