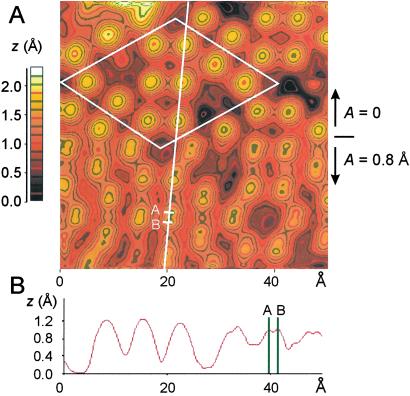
Fig 2.
(A) Topographic scanning tunneling microscopy image of the Si(111)-(7 × 7) surface recorded with a sample bias voltage of 1.6 V and an average tunneling current of 150 pA. The top half of the image was acquired with a nonoscillating sensor, and the lower half was recorded with an oscillation amplitude A = 0.8 Å. The tip was oscillating parallel to the surface. (B) Contour line, showing the split adatoms in the lower section of the image. The distance of the two subpeaks is twice the oscillation amplitude (1.6 Å). The white diamond indicates the surface unit cell with a short diagonal of 26.9 Å and a long diagonal of 46.6 Å.

