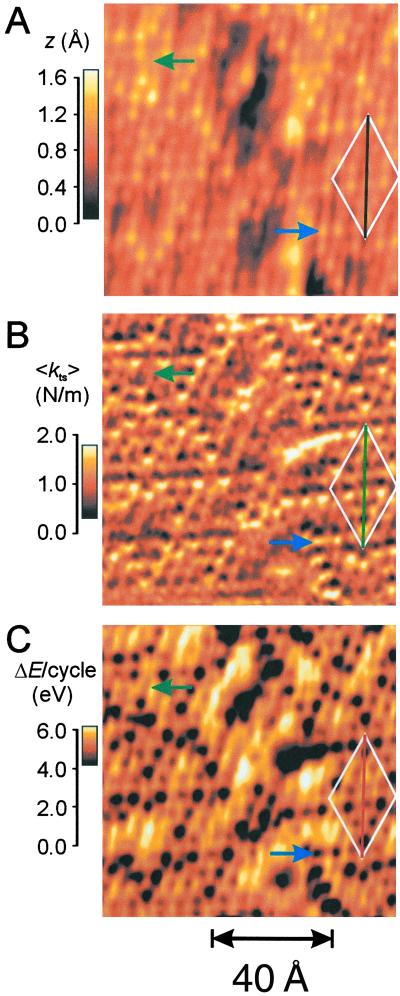
Fig 3.
Topography (A), average lateral stiffness (B), and damping signal (C) recorded simultaneously while imaging an Si(111)-(7 × 7) surface. The green arrows indicate an atomic defect (missing corner adatom). Parameters: feedback on average tunneling current, 400 pA; sample bias voltage, −0.8 V; scanning speed, 4 lines per sec (vertical); cantilever oscillation amplitude, A = 3 Å; tilt angle, θ ≈ 6°; cantilever spring constant, k = 1,350 N/m; and eigenfrequency, f0 = 10,214 Hz. The white diamonds indicate the surface unit cells. The black, green, and red lines across the long diagonals of the unit cells correspond to the traces where topography, frequency shift, and damping are plotted in Fig. 4. The blue arrows indicate the atom that is shown in magnification in Fig. 5 B–D.

