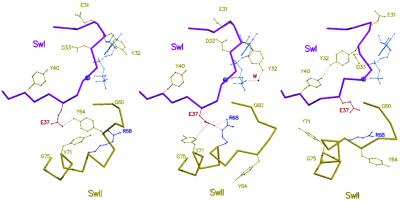
Fig 2.
Structural changes that affect the switch 1 and switch 2 regions of Ras along the path for GTP hydrolysis. Structures proceed from the GTP-bound form (Left, PDB coordinates 5P21), to the intermediate (Center) that is represented by the A59G mutant, and finally to the GDP-bound form (Right, PDB coordinates ). Water molecules are shown as red spheres; the nucleotide and the Mg2+-ion are in light blue. Switch 1 is in magenta and switch 2 in gold. Close contacts are represented by dotted lines.

