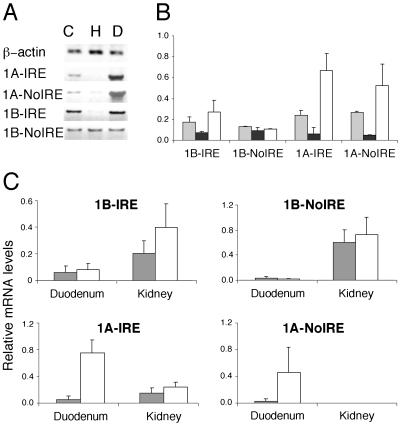
Fig 5.
Iron regulation of the four alternative isoforms of DMT1 mRNA in Caco-2 cells (A and B) as well as mouse kidney and duodenum (C). (A) Caco-2 cells were treated as described in Fig. 1. Total RNA was analyzed by semiquantitative RT-PCR using isoform-specific forward and reverse primers, as described in the text. PCR cycles (16) were used to amplify hβ-actin cDNA, 27 cycles for 1A-IRE, 1B-IRE, and 1B-non-IRE cDNAs, and 31 cycles for 1A-non-IRE cDNA. (B) Quantification of three experiments like the one shown in A by RT-PCR. Gray bars correspond to control, black to hemin, and white to desferrioxamine to treated samples. (C) Quantification of the expression of the four mDMT1 mRNA isoforms in duodenum and kidney from mice fed with an iron deficient diet (white bars) or with a control diet (gray bars). Bars represent average values obtained from four mice each ± SD. No expression of the 1A-non-IRE isoform was detected in kidneys.

