
Figure 1.
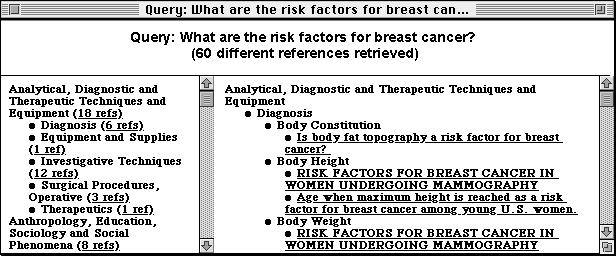
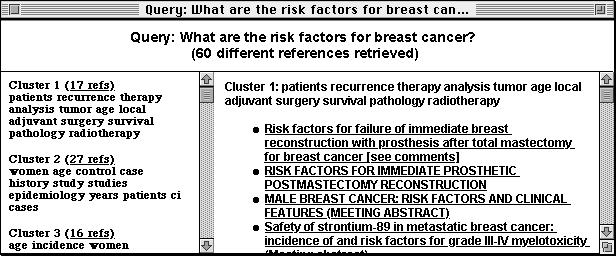
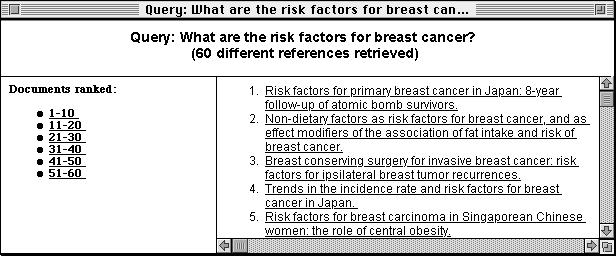
The interfaces to DynaCat (top), the cluster tool (middle), and the ranking tool (bottom). All interfaces are divided into three frames, or window panes. The top window pane displays the user's query and the number of documents found. The left pane provides a table of contents view of the organization of search results. The right pane displays all the document titles using the organization of the scheme of the tool.