
Figure 3.
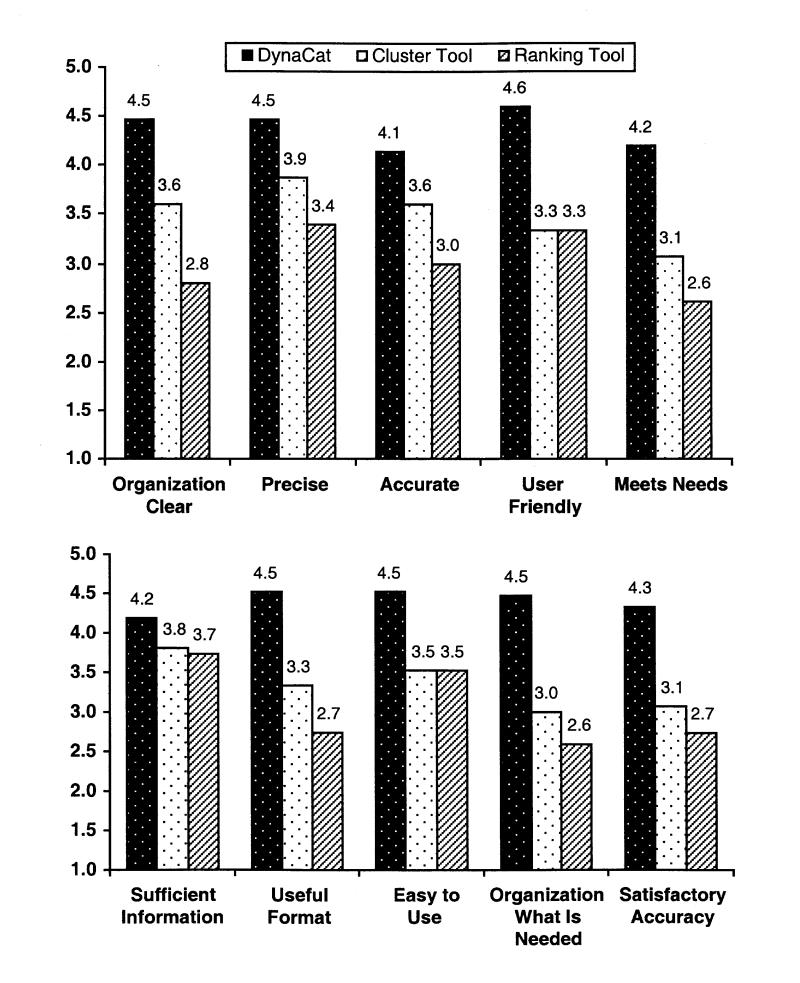
Results from the validated user-satisfaction questionnaire. The mean values across all 15 subjects are shown on the y axis. The x axis shows a brief summary of the questions asked. (See the Appendix for the full questionnaire.) Subjects answered the questions using a scale from 1 to 5, where 1 meant “almost never” and 5 meant “almost always” (the ideal answer). The difference between DynaCat and the cluster tool was statistically significant (P < 0.05) for all five questions, as was that between DynaCat and the ranking tool, with the exception of question 6, about sufficient information, which had a P value of 0.11.