
Figure 4.
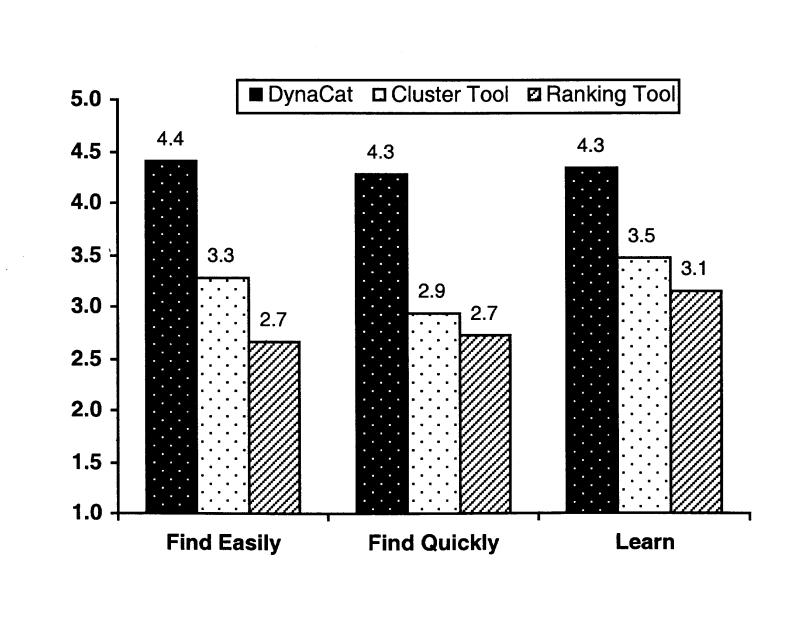
Results from the user-satisfaction questionnaire. The mean values across all 15 subjects are shown on the y axis. The x axis shows a brief summary of the questions asked (questions 11, 12, and 14; see the Appendix for the full questionnaire.) Subjects rated the statements on a scale from 1 to 5, where 1 meant “strongly disagree” and 5 meant “strongly agree” (the ideal answer). The difference between DynaCat and the cluster tool was statistically significant (P < 0.01), as was the difference between DynaCat and the ranking tool.