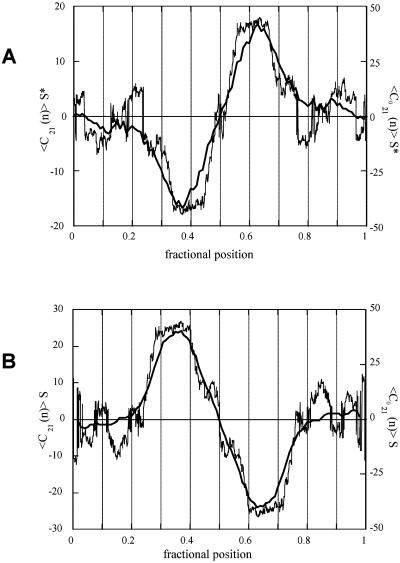
Figure 4.
Experimental and theoretically predicted local curvature for the head-to-head (A) and the tail-to-tail (B) curved dimers. The average S* shape of the experimental curvature for the head-to-head dimer and the average S shape for the tail-to-tail dimer are evident from the signs of the halves of the two curvature profiles. The theoretical curvatures for the correspondent flattened molecules are displayed as thin traces. The experimental and theoretical curvatures refer to a DNA tract of 21 bp.

