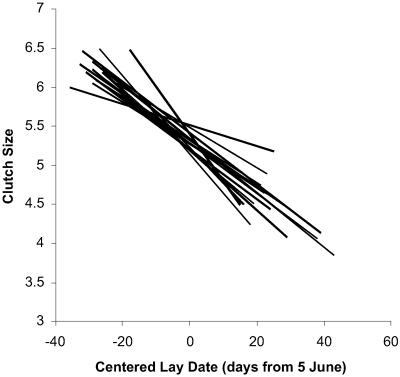
Figure 2.
The corrected regressions between clutch size and date of egg laying (clutch initiation) for the 17 years from the sample that had slopes significantly (P < 0.05) different from 0. These are estimates of clutch size corrected for all the other covariates in Table 1 by forcing SAS to calculate separate intercepts and slopes for each year as fixed effects. Each regression line is drawn only to the limits of the data set for each year. Note the similarity of observed slopes and the relatively minor differences among the regression intercepts across years.

