Figure 1.
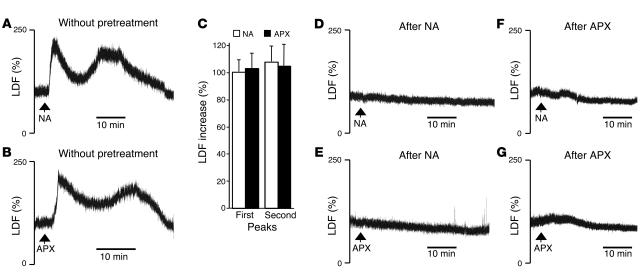
Nicotinic acid– and acipimox-induced flushing response in the mouse external ear and its desensitization. (A and B) Original recordings of the LDF signal in the ear artery. Mean baseline LDF represents 100% on the vertical scale. Nicotinic acid (NA) or acipimox (APX) were injected i.p. in doses of 200 mg/kg at the time points indicated by arrows. (C) Quantitative analysis of the percentage of LDF increase after administration of NA (white bars, n = 21) and APX (black bars, n = 11) during the first and second peaks of flushing. (D–G) Animals were pretreated with 200 mg/kg (i.p.) of NA (D and E) or APX (F and G) 120 minutes before the administration of NA (D and F) or APX (E and G). Shown are representative recordings of 5–6 experiments per group.

