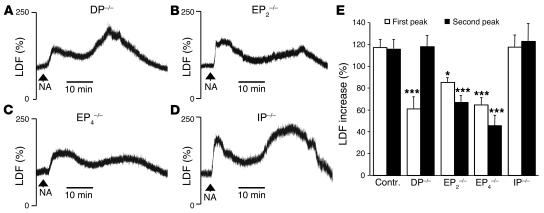
Figure 3.
NA-induced flushing involves EP2, EP4, and DP but not IP. (A–D) Original recordings of the flushing response to nicotinic acid (200 mg/kg i.p.) in DP–/– (A), EP2–/– (B), EP4–/– (C), and IP–/– mice (D). (E) Quantitative analysis of the percentage of LDF increase in response to NA in wild-type control animals (n = 27) and the indicated mutants (n = 6–15). *P = 0.013; ***P < 0.001 vs. control (contr.).

