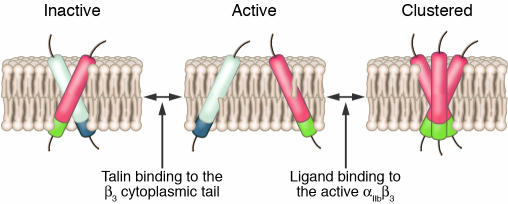
Figure 5.
Diagram illustrating the “push-pull” hypothesis for regulation of the αIIbβ3 activation state. The white and blue cylinders represent the αIIb TM and membrane-proximal cytoplasmic domain helices, respectively. The red and green cylinders represent the β3 TM and membrane-proximal cytoplasmic domain helices, respectively.

