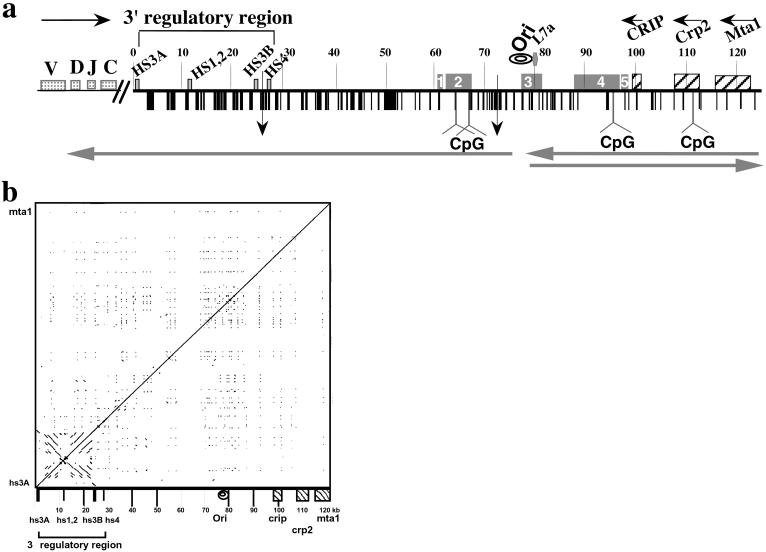
Figure 1.
Structural features of the 125 kb DNA insert of 199M11. (a) Schematic of sequence features of BAC199M11 (GenBank accession no. AF450245). Position 1 in 199M11 is the telomeric end of the chromosome segment cloned in this BAC and corresponds to position 1242 of GenBank accession no. K00691 (Cα membrane exon). The Igh locus is in inverted transcriptional orientation on chromosome 12 so that the 5′ end of the locus is distal (telomeric). “Downstream” with respect to Igh is proximal on the chromosome, and we will use upstream, or 5′, and downstream, or 3′, to describe a position relative to Igh, not the chromosome. V, D, J, and C sequences are located upstream of BAC199M11 sequences, Although there are two small gaps in the 199M11 sequence (indicated by vertical arrows at 26,423, between hs3b and hs4 enhancers, and at position 71,578), each estimated to be <500 bp, we present the data as a continuous sequence 1 to 124,151 (GenBank Accession no. AF450245). Repetitive DNA sequences identified by Repeat Masker and by individual searches of DNA segments are shown with vertical black bars and specifically identified in GenBank accession no. AF450245. A higher density of repetitive sequences is apparent closer to the Igh gene cluster and a relatively lower density toward the downstream end of the BAC. Igh regulatory elements, L7a pseudogene, Crip, Crp2, and Mta1 genes and CpG islands (at 64180–65703; 67270–67539; 96721–97360; and 112328–113229) are indicated. Transcription direction is indicated by horizontal arrows above the sequence, and direction of replication fork movement is indicated by horizontal arrows below the sequence. A region within which the direction of replication fork movement changes is indicated by “ori”. An A/T-rich segment is located at 77,700–77,746. Locations in the 199M11 sequence are given as distance from the Igh end; e.g., 199M11:99 is 99 kb from the IgA membrane exon (5′) end of 199M11. ESTs are indicated by rectangular boxes containing nos. 1–5. EST region 1 (61,000–61,484) matches a single EST from heart-AA646361 (5′ end sequence of IMAGE clone 1021178; the 3′ sequence of this clone has not been determined). Much of EST region 2 (62,082–67,432) is contained in AK010454, which has been termed a full insert mRNA sequence that encodes a gene. Multiple ESTs matching this region have been identified as part of UniGene Cluster Mm. 133306 Mus musculus. EST region 3 (77,453–81,342) matches two IMAGE clones that appear to be identical, 641181 (5′ sequence, AI605834, and 3′ sequence, AI450404) and 3418382 (5′ sequence, BE848059, and 3′ sequence, BE853477). This region, identified in UniGene Cluster Mm. 32319 Mus musculus, contains the replicative boundary in MEL [199M11:76–79 and a previously unidentified L7a pseudogene (199M11:79)]. The gene encoding the L7a protein (Surf-3) (32) appears to be present in a single copy within the mouse surfeit locus on chromosome 2 (52); and there are 15–20 L7a-related family members, three of which have been analyzed and found to have the hallmarks of processed pseudogenes (53), i.e., lack of introns, presence of multiple defects that would prevent translation, and flanked by direct repeats of 13–15 bp. Immediately 3′ of the L7a homology region in 199M11, there is a B2/SINE element followed by a short poly(A) tract. EST region 4 extends ≈9 kb from 87,921–96,874, within which several ESTs have been arranged in two UniGene Clusters: Mm 87616 Mus musculus (87,921–88,550) and Mm. 90118 Mus musculus (88,807–95,766). Within UniGene Cluster Mm. 90118 is BC022617, which has been identified as an mRNA/gene sequence, although a predicted protein sequence is not clearly specified. Comparison of BC022617 to 199M11 suggests that the gene encoding BC022617 contains at least five exons. EST region 5 (97,382–98,337) shows three matches, including to the 5′ (BE624876) and 3′ (BE629214) ends of IMAGE clone 3370299. (b) DotPlot analysis (54) (http://bio.cse.psu.edu/pipmaker) of 199M11 to identify internal repetitive sequences shows unique features associated with the 3′ Igh regulatory region, namely an extensive palindrome and multiple repetitive sequences. Parallel lines indicate direct repeats and perpendicular lines indicate inverted repeats.

