
Figure 1.
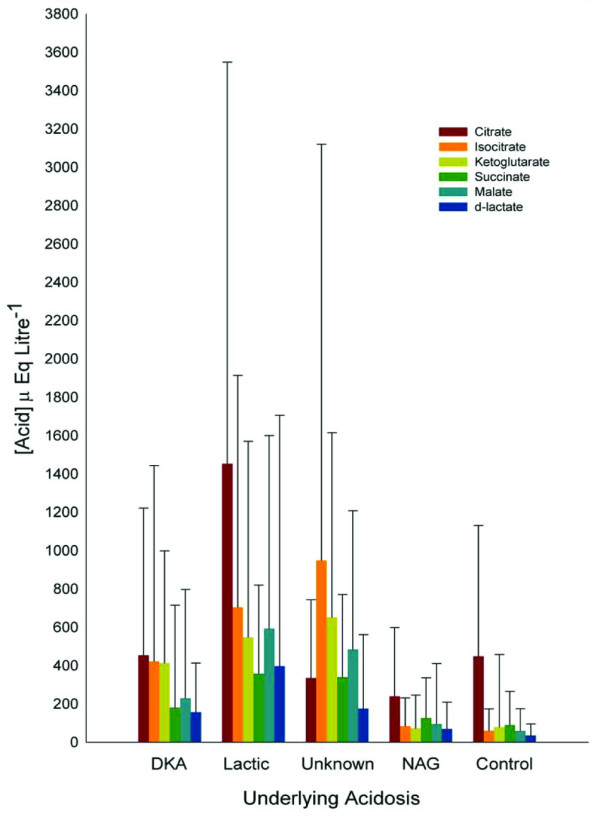
The concentration of various weak acids grouped by their underlying aetiology (mean ± upper range). DKA, diabetic ketoacidosis; NAG, normal anion gap.
Official websites use .gov
A
.gov website belongs to an official
government organization in the United States.
Secure .gov websites use HTTPS
A lock (
) or https:// means you've safely
connected to the .gov website. Share sensitive
information only on official, secure websites.
The concentration of various weak acids grouped by their underlying aetiology (mean ± upper range). DKA, diabetic ketoacidosis; NAG, normal anion gap.