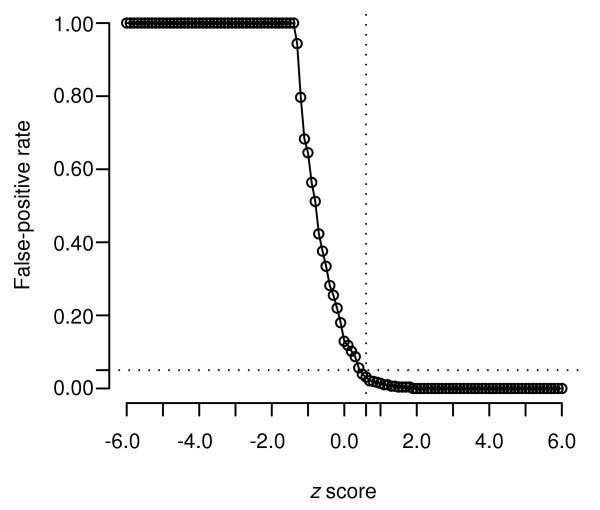
Figure 3.

False-positive rate as a function of z score. False-positive rate as a function of z score can be used to measure the confidence of an individual prediction. The rate of false positives predicted by the method is shown as a function of the z scores used to evaluate inter-AG distances. False-positive rates were estimated for a range of z scores from -6 to +6 based on known splice sites in the training data. The dotted lines indicate that a z score of 0.6 or greater will yield a false positive rate of just 5%. In other words, inter-AG segments with a z score of 0.6 or greater will have a 95% confidence of being trans-splicing regions.
