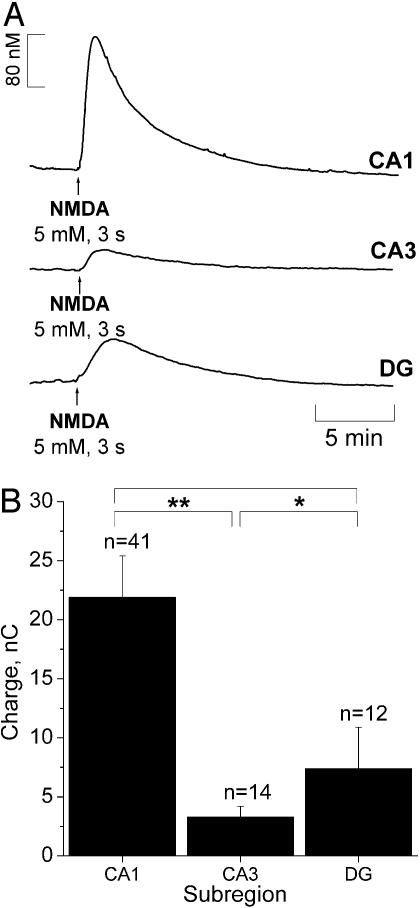
Fig. 3.
NMDA-evoked  production in hippocampus. (A) Typical current recordings in distinct subregions of the rat hippocampal slice. In the CA1 and CA3 subregions recordings were performed in the pyramidal cell layer, and in the DG they were performed in the granular cell layer. (B) Average charge was measured in each subregion upon NMDA receptor activation. Statistical analysis of the differences were assessed by Student's t test (*, P > 0.05; **, P < 0.05).

