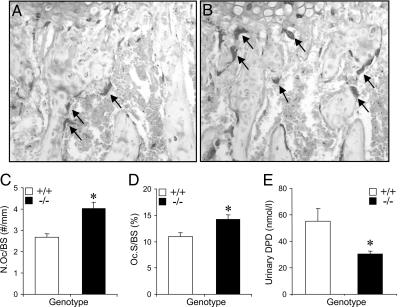
Fig. 3.
TRPV5-/- mice exhibit enhanced osteoclastogenesis but reduced resorption. (A and B) TRACP staining was performed on femoral bone sections from TRPV5+/+ (A) and TRPV5-/- (B) mice, and images were taken of the metaphyses. Arrows indicate osteoclasts. (C and D) Osteoclast number (C) and osteoclast surface area (D) per bone surface area was quantified (n = 7-8). (E) Urinary DPD levels were measured in TRPV5+/+ and TRPV5-/- mice (n = 9). Values are presented as mean ± SEM. *, P < 0.05 versus TRPV5+/+ mice.

