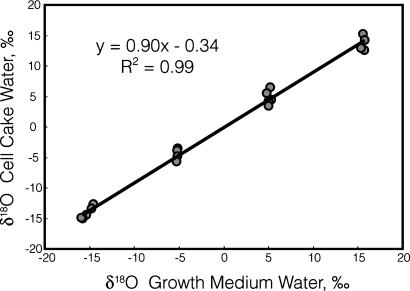
Fig. 1.
Regression of the oxygen isotope ratio of extracted cell cake water versus that of growth medium water. Data are from five experiments in which cells were grown in 2× LB and harvested at mid-log phase. The standard errors of the slope and intercept are 0.019 and 0.21, respectively. Error bars representing the standard error of measurement for each data point are concealed within the symbols on the graph.

