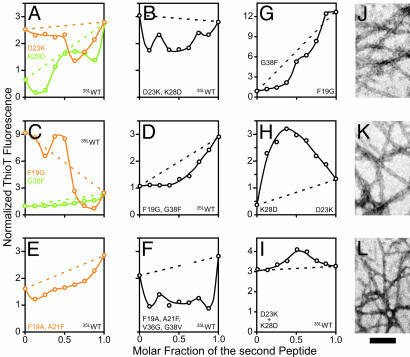
Fig. 3.
Phase behavior of binary 35LAβ(1–42) peptide mixtures. (A–F) Plots of the normalized ThioT fluorescence against the mixing ratio with 35LAβ(1–42), as observed after 2 months of equilibration at room temperature. (G–I) Plots of the normalized ThioT fluorescence against the mixing ratio of two variant Aβ peptides. In A–I, the identities of the peptides present in the mixtures are indicated next to the corresponding y axis on each diagram. Plots corresponding to variants of the β1-strand are shown in orange, plots corresponding to variants of the β2-strand or its preceding loop are shown in green, and plots corresponding to double variants are shown in black. Dotted lines in the corresponding colors indicate the ThioT fluorescence that would be expected if the peptides in the mixture would not interact and thus aggregate independently of each other. The ThioT signal was normalized to the fluorescence signal of the single tyrosine in Aβ(1–42). (J–L) Negatively stained electron micrographs corresponding to the samples at a molar fraction of 0.5 in G–I, recorded at a nominal magnification of ×72,000. (Scale bar, 100 nm.)

