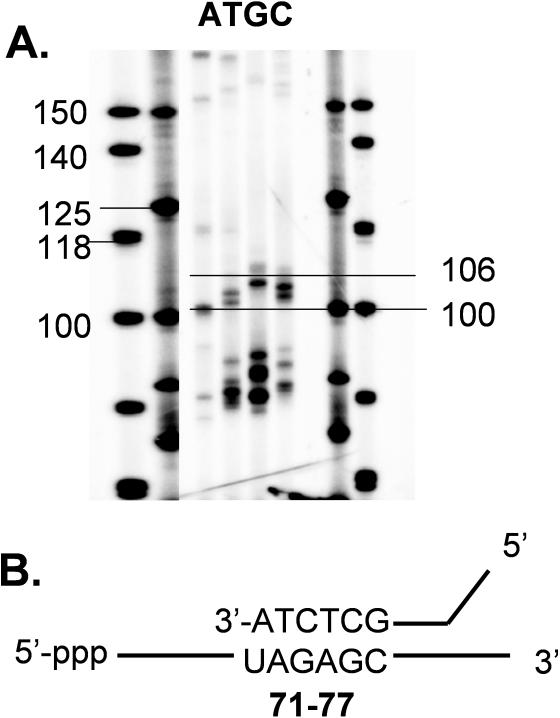
Figure 3.
Interpretation of the RT-ROL gel. (A) Blowup of boxed section of gel in Figure 2 showing the approximate alignment of the bands with standard length markers. (B) Alignment of the observed bands with the mRNA sequence, taking into account the sequence of the mRNA and the terminal nucleotide on the primer, along with the fact that the PCR tag adds an additional 20 nt to the extra 9 random nucleotides in the PCR amplified product band.

