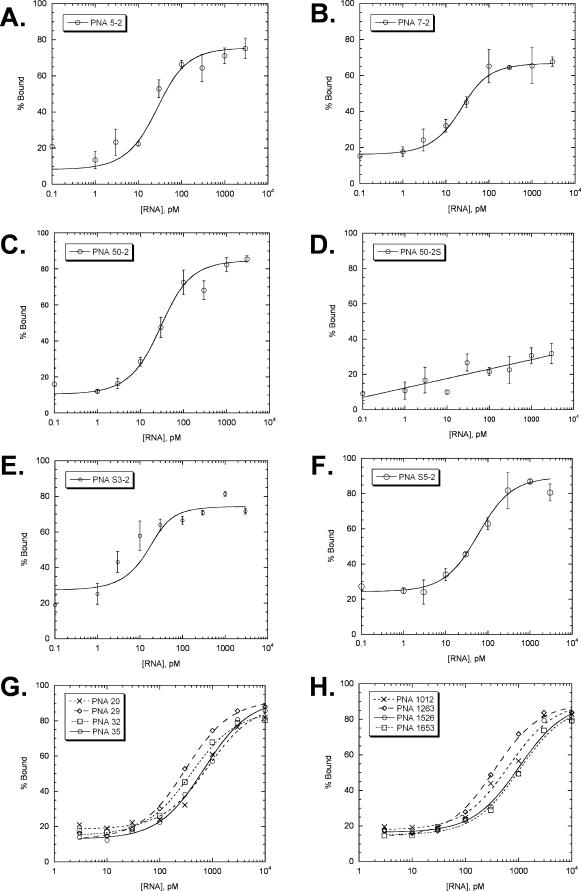
Figure 7.
Curve fits to the PNA binding data from the Dynabead assay. (A–C) antisense PNAs corresponding to high affinity antisense ODNs identified by the RT-ROL assay, (D) sense PNA corresponding to PNA50-2, (E and F) antisense PNAs corresponding to high affinity antisense ODNs identified by the SAABS assay, (G) antisense PNAs corresponding to low affinity antisense ODNs identified by the RT-ROL assay, (H) antisense PNAs corresponding to sites not identified by either assay. The error bars represent the standard deviation of the average of three experiments and are not shown for (G) and (H) for clarity.

