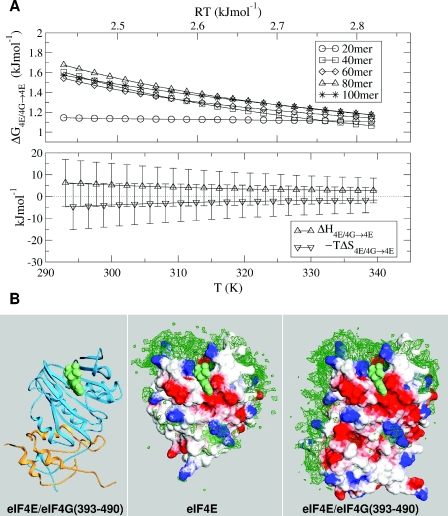
Figure 2.
Binding of mRNA to eIF4E and eIF4E complexed to an eIF4G fragment. (A) Temperature-dependence of binding differential (ΔG4E/4G→4E, ΔH4E/4G→4E, −TΔS4E/4G→4E), with more favourable binding to eIF4E/4G complex denoted by positive ΔG values. Results (ΔG) are shown for variable polymer length. (B) RNA monomer densities (green) around eIF4E and eIF4E/4G complexes, with electrostatic potential surfaces at −kBT/e (red) and kBT/e (blue). The ribbon diagram is colour-coded according to eIF4E (cyan) and eIF4G fragment (orange), with a spacefilled cap analogue in all panels. This figure was drawn with Swiss PDB-Viewer (46).

