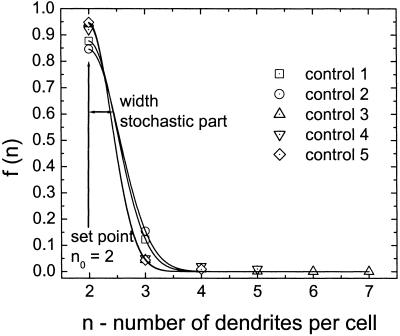
Fig 6.
Density functions for the number of dendrites in control cultures. The data points represent the observed numbers of dendrites and the lines, the estimated density functions. All observed data could be fitted well by Eq. 5. The least-square fit gives the width of the distribution; the set point n0 = 2 is a fixed parameter determined by the observed maximum of the distribution. The set point and the width are identical in all samples, which leads to a mean signal-to-noise ratio of S/N = 4.47 for controls. Note: The model and the equations were derived from theoretical considerations and parameterized from the observed data.

