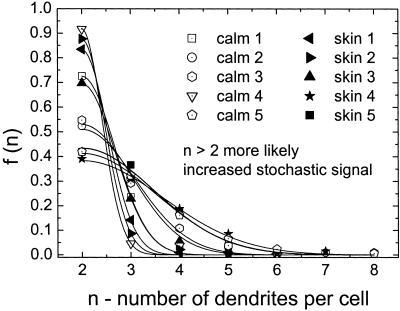
Fig 7.
The density functions for the number of dendrites of NF1 melanocytes. Data were observed from cells of five NF1 patients. The cells were taken either from normal skin (skin 1–5) or from café-au-lait macules (calm 1–5). As for the controls, the maximum of the density distribution and therefore the set point is the same for all NF1 samples (n0 = 2). However, the dendrite density distribution is broader compared with control melanocytes (Fig. 6), strongly indicating an increased noise term in our model. The resulting signal-to-noise ratio of NF1 cells (S/N ≈ 2.6) is ≈40% less compared with the controls (S/N ≈ 4.5).

