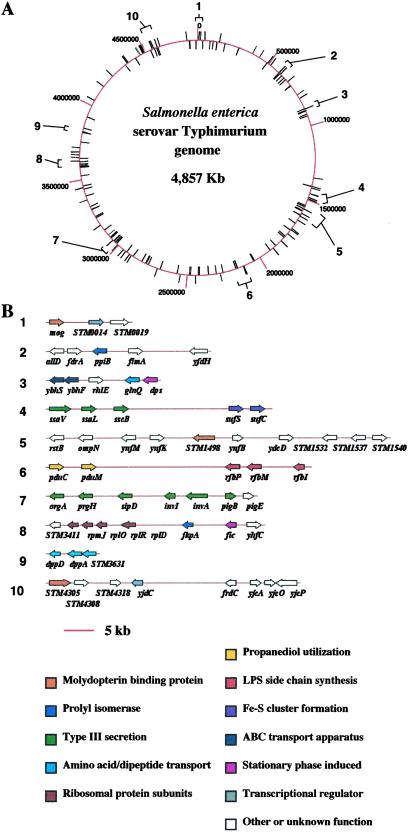
Figure 1.
Chromosomal organization of the S. enterica serovar Typhimurium LSMMG regulon. (A) The circular Salmonella chromosome is schematically depicted with kilobase coordinates, noted as red lines extending from the chromosome. LSMMG-regulated genes as identified by microarray analysis are noted as black lines extending from the chromosome. Numbered brackets indicate clusters of genes that are physically linked (within 50 kb) or organized into the same operon and are shown in greater detail in B immediately below. (B) Clusters of LSMMG-regulated genes are schematically depicted. The numbers next to each cluster correspond to the numbered brackets in A. The LSMMG-regulated genes are depicted as arrows and are colored according to a common function. Only those genes that are LSMMG-regulated are shown for each cluster. Both up- and down-regulated genes are sometimes present in the same cluster. The regulatory profiles of the genes are found in Table 1, which is published as supporting information on the PNAS web site.

