Figure 1.
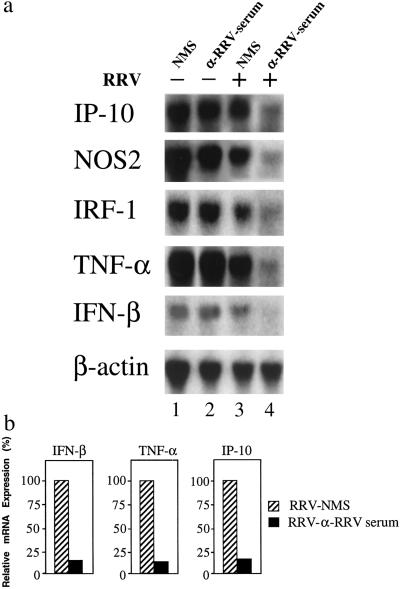
Suppression of antiviral genes in RRV-ADE-infected macrophages. (a) Northern blot analysis of messenger RNA expression specific for IP-10, NOS2, IRF-1, TNF-α, and IFN-β in LPS-stimulated (250 ng/ml) RAW 264.7 cells 24 h post-RRV-ADE infection (RRV + 10−3 anti-RRV serum). Control mRNA expression is represented by β-actin. (b) Northern blots were quantified by PhosphorImager (Molecular Dynamics) analysis, and relative mRNA levels (IFN-β, TNF-α, and IP-10) are presented as the percentage of expression in RRV-non-ADE (RRV + NMS) control-infected cultures.

