
Fig. 3.
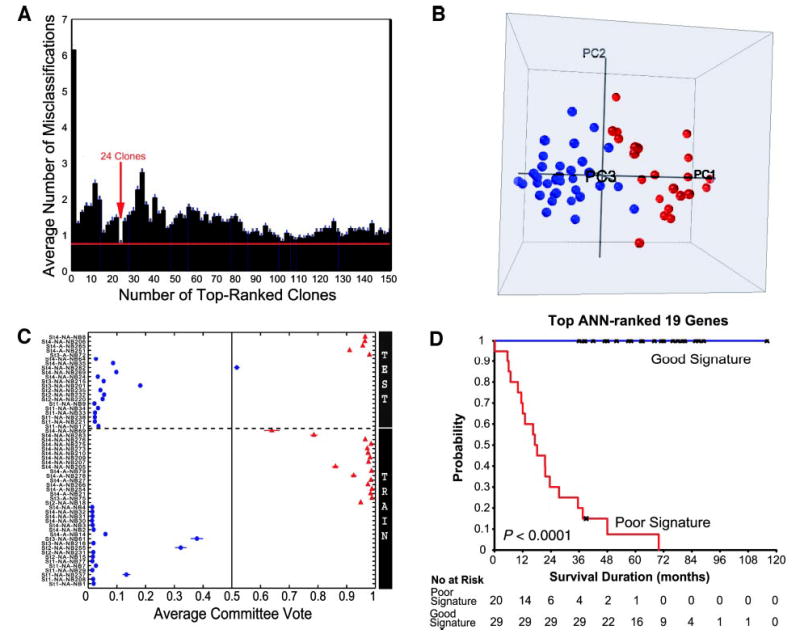
Outcome prediction using top artificial neural network (ANN)-ranked genes. A, clone minimization plot for ANN prediction. ANNs were first trained using the 35 training samples, and all 37,920 clones were ranked according to their importance to the ANN prediction (7). Then ANNs were trained with increasing numbers of the top ANN-ranked clones, and average prediction errors were calculated for the 35 training samples. The minimal number of clones that generated the minimal error rate was 24 (arrow), representing 19 unique genes. Bars, ±SE of number of misclassifications for the validation group during ANN training. B, plot of the top 3 principal components of the 56 neuroblastoma samples using the top 19 genes (duplicated clones of the same gene were removed, and the top-ranked clone for each gene was used in the ANN prediction) demonstrates a clear separation according to the clinical outcome. Red spheres, poor-outcome patients, whereas blue spheres, good-outcome patients. C, ANN committee vote results of the 56 samples using the top 19 ANN-ranked genes. ANNs were retrained using the 35 training samples (including all of the replicated samples) with the top 19 ANN-ranked genes directly without PCA, and these trained models were used to predict the 21 independent test samples. Horizontal dotted line divides the test (above the line) from the training samples. D. Kaplan-Meier curves for survival probability of the 49 patients were derived from the ANN prediction using the 19 genes in C.