Figure 3.

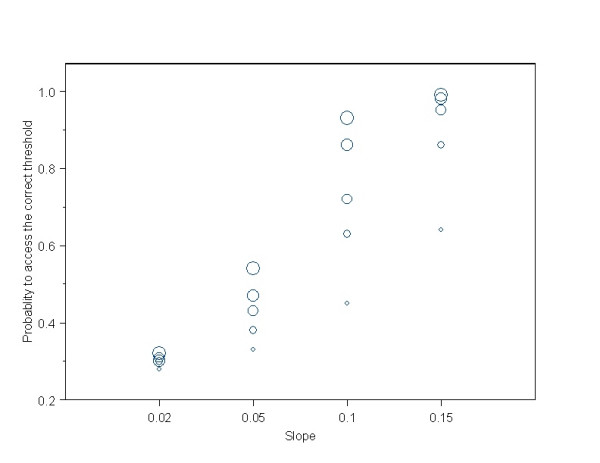
Power of reduced isotonic regression to detect the correct threshold in shape C for different slopes. The size of the circle is proportional to the sample size per dose group (N = 50, 100, 150, 200, 250).

Power of reduced isotonic regression to detect the correct threshold in shape C for different slopes. The size of the circle is proportional to the sample size per dose group (N = 50, 100, 150, 200, 250).