Figure 5.
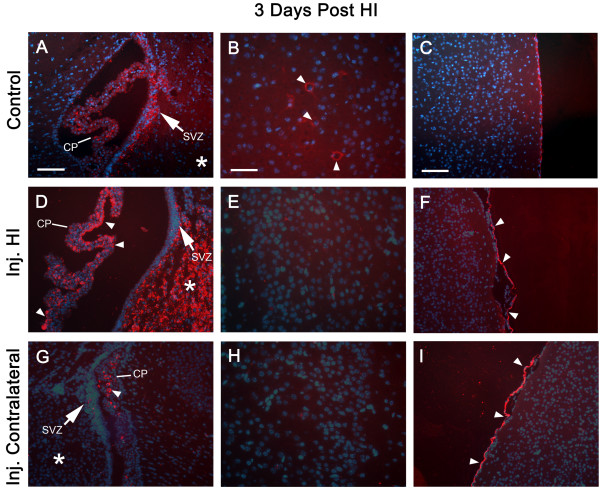
Constitutive and Injury Induced Expression of SDF-1. All panels are from P10 murine neonates. Panels A-C are from a non-Hypoxia-Ischemia (HI) control animal; D-I are from an animal that underwent HI injury three days previously at P7. Panels D-F are from the HI injured hemisphere and G-I from the corresponding contralateral (non-ischemic) hemisphere. Panels A, D, and G are of the lateral ventricle including the CP, SVZ (arrow) and adjacent striatum (*); arrowheads indicate SDF-1 expression (Cy3 – red) in the CP, scale bar equals 100 μm. Panels B, E, & H are of the cingulate cortex, arrowheads indicate SDF-1 expression in neurons, scale bar equals 50 μm. Panels C, F, and I show cortex and meninges, arrowheads indicate SDF-1 expression in mesothelial cells of the pia, scale bar equals 100 microns. Cell nuclei were identified by bis-benzimide counterstaining (blue). Abbreviations: choroid plexus (CP) and subventricular zone (SVZ).

