Figure 7.
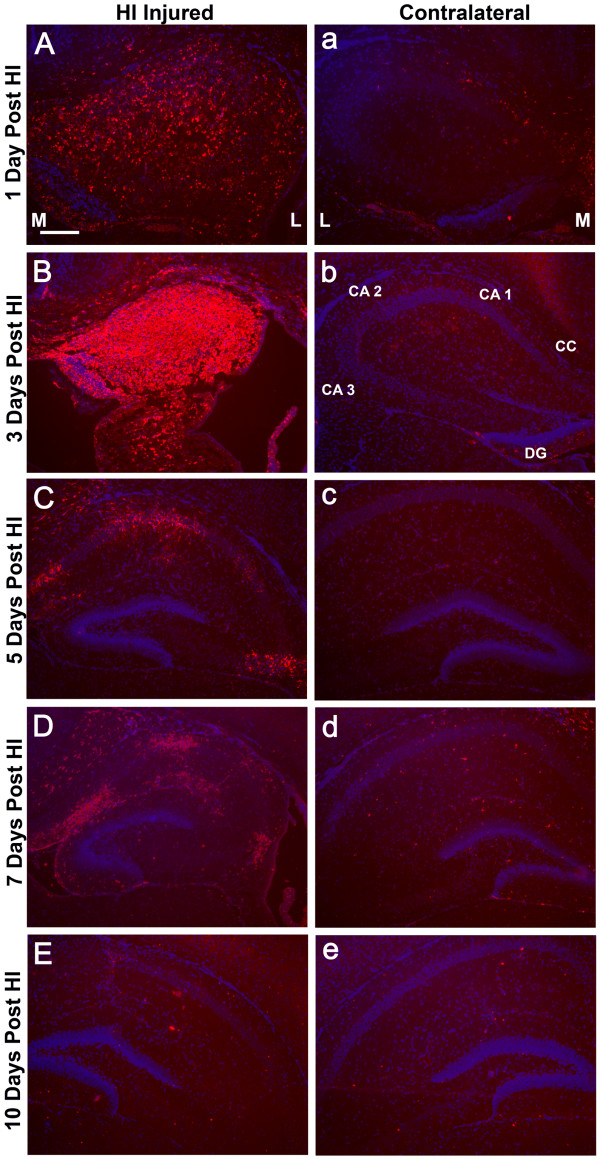
Temporal Expression of SDF-1 in Hippocampus Post-HI. Shows examples of hippocampal expression of SDF-1 at different time points post hypoxia-ischemia (HI) demonstrated by immunohistochemistry (Cy3 label – red), this includes 1 (P8), 3 (P10), 5 (P12), 7 (P14) and 10 (P17) days following HI. Panels A-E are from the ischemic hemisphere and a-e are from the contralateral hemisphere. M and L denote the medial and lateral aspects of the hippocampi respectively. Hippocampal regions are indicated: cornu ammonis (CA 1, 2 & 3), corpus callosum (CC), and dentate gyrus (DG). Cell nuclei were identified by bis-benzimide counterstaining (blue). Scale bar equals 200 μm.

