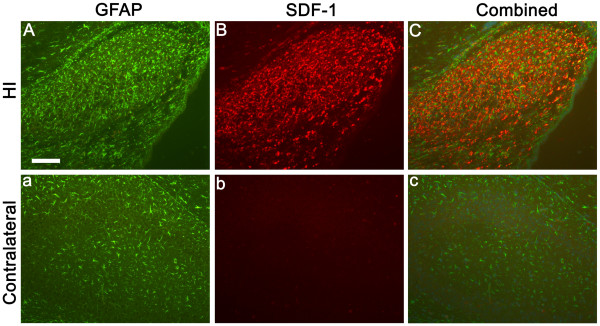
Figure 8.
SDF-1 and GFAP Co-localization. Panels A-C are from a P10 hippocampus, three days post-HI, from the ischemic hemisphere, a-c are from the corresponding contralateral hippocampus. Panels A & a demonstrate the astrocyte marker GFAP (FITC – green). Panels B & b show SDF-1 expression (Cy3 – red). Panels C & c indicate the overlap between GFAP and SDF-1 labeling. Scale bar equals 100 μm.

