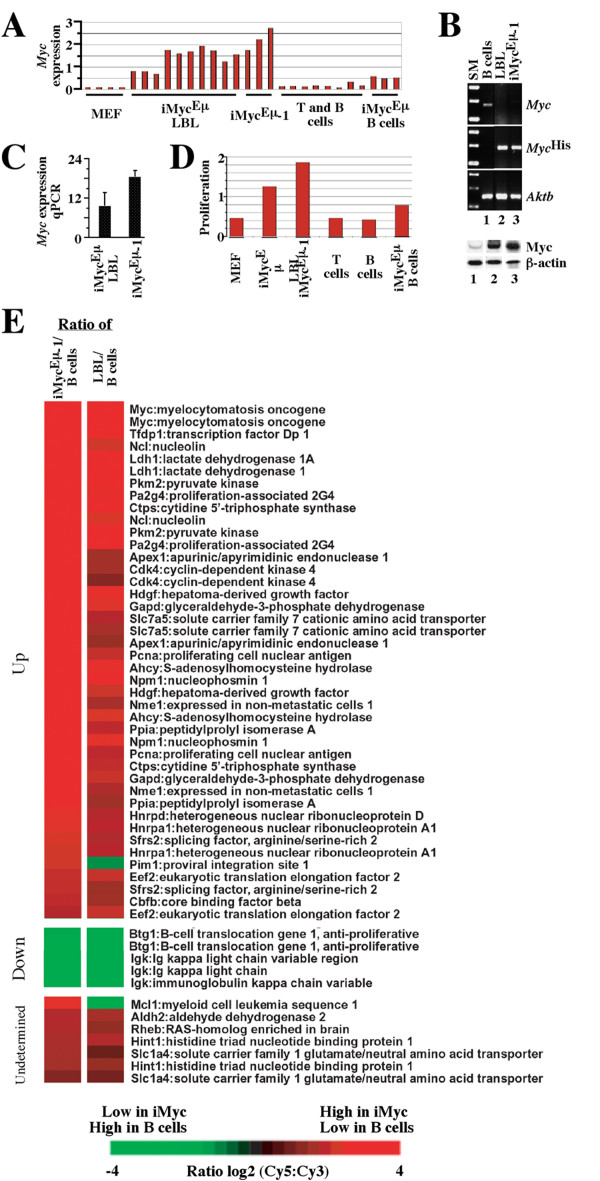
Figure 4.
Myc expression and Myc-driven gene expression changes in iMycEμ-1 cells. A, expression of Myc in iMycEμ-1 cells, LBL, and normal controls. The average gene expression was calculated and plotted according to the microarray measurements shown in Figure 3. B, RT-PCR of Myc, MycHis and Aktb mRNA levels (top) and Western blotting of Myc protein (bottom) in normal B cells (lane 1), LBL from an iMycEμ mouse (lane 2), and the iMycEμ-1 cell line (lane 3; SM, size marker). C, real-time qPCR analysis of Myc mRNA levels in iMycEμ-1 and LBL cells. Mean values and standard deviations based on three independent iMycEμ-1 and five LBL samples are shown. D, expression of proliferation signature genes in iMycEμ samples and normal controls. The expression of genes that fall in the proliferation signature defined in Figure 3 was averaged for each cell population and plotted. E, differentially expressed Myc targets in iMycEμ-1 cells (left column) and LBL (right column) compared to normal resting B cells. Relative gene expression levels are depicted according to the color scale at the bottom. Gene designations and names are listed to the right.

