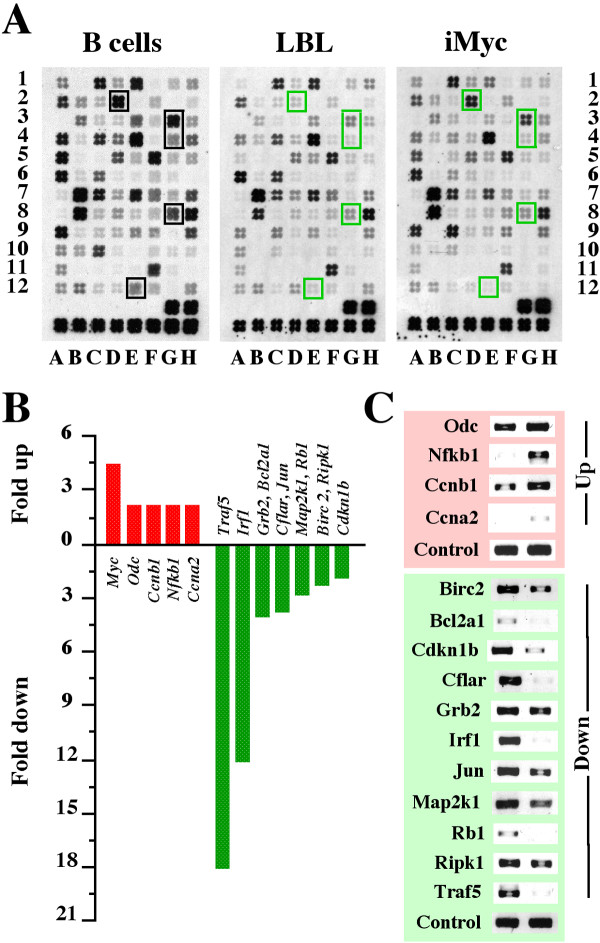
Figure 5.
Concordant gene expression changes in iMycEμ-1 cells and LBL compared to normal B cells. A, gene expression changes were assessed by comparative filter cDNA macroarray measurements using a representative apoptosis array of normal B cells (left), LBL (center) and iMycEμ-1 cells (right) as the example. Compared to B cells, LBL and iMycEμ-1 cells under-expressed Bcl2a1d (array position D2), Birc2 (G3), Cflar (G4), Ripk1 (G8) and Traf5 (E12; indicated by green squares). Additional File 3 shows four additional LBL arrays that exhibit the same changes. B, expression changes of 5 up-regulated and 11 down-regulated genes in iMycEμ-1 cells compared to normal B cells (see Additional File 6 for names, functions and groupings of these genes). Similar changes were seen when LBL and B cells were compared using cDNA macroarrays (not shown) or when iMycEμ-1 cells and/or LBL were compared to B cells using cDNA microarrays (Fig. 3; results not shown). C, verification of gene array results using RT-PCR. Shown are ethidium bromide-stained PCR fragments of the differentially regulated genes plotted in panel B except Myc, which was verified in the experiments presented in Figure 4A-C. The iMycEμ-1 and B-cell samples are shown in the right and left lane, respectively. Up and down regulated genes are depicted on the pink and green background, respectively.

