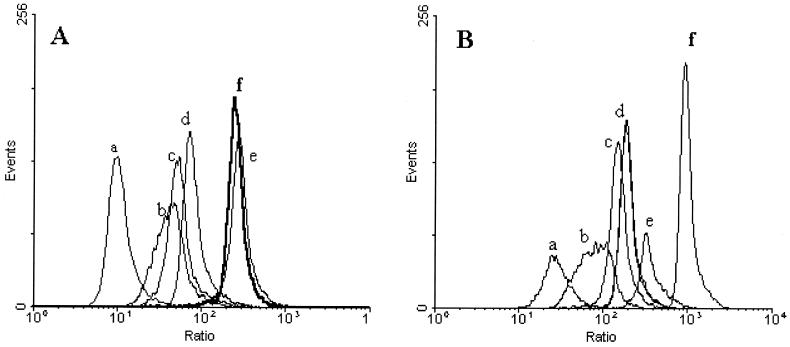
FIG. 2.
Fluorescence histogram overlays of B. lactis DSM 10140 (A) and B. adolescentis DSM 20083 (B) stained with 1 μM DiBAC4(3) for 4 min at 37°C. The x axis represents the corrected DiBAC4(3) fluorescence for the cell size, obtained by calculating the log ratio of the green fluorescence of DiBAC4(3) to the side scatter intensity. Results are shown for control untreated cells (a), for cells exposed to 0.05% (b), 0.1% (c), 0.2% (d), or 0.25% (e) dBS, and for cells that were heat treated at 70°C for 30 min (f).

